NINDEX review
Introduction
NINDEX monitor is an EEG monitor for automatic measuring of depth of anaesthesia, intended for use in operating rooms, intensive care units and research.
The NINDEX monitor records and processes the EEG to continuously calculate a dimensionless number called NINDEX. NINDEX number gradually descends with increasing anaesthetic depth. In this way, the anesthesiologist gets real time anaesthetic depth information without any special knowledge of the EEG.
NINDEX monitor was developed by Controles S.A. (www.controles.com) and Dr. Daniel Cibils.
Potential benefits of NINDEX monitoring
In today's clinical practice, the routine general anesthesia does not include the monitoring of the brain, that is, the main target structure of the anaesthetic drugs. Changes on Nervous System activity in patients are measured through indirect signals from the Autonomic Nervous System, mainly cardiovascular parameters and motor responses. These signals may fail to reliably monitor the depth of anaesthesia.
NINDEX monitor adds a direct measurement of brain activity by the anesthesiologist. Potential benefits from the routine use of NINDEX monitor include:
- Improved titration of anesthetic drugs, allowing for adjusting the dosages to the patients' age, gender and general physical condition
- Decreased risk of unintended intra-operative awareness
- Decreased risk of too deep anaesthesia levels that could be potentially hazardous to the patient
- Decreased recovery time from anaesthesia and stay time in PACU
- Valuable aid in TIVA
It also has been shown that use of EEG monitors is associated with significant savings in anaesthetic drugs.
Product review
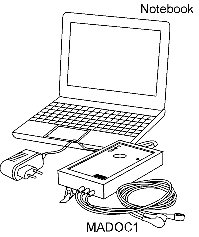
NINDEX monitor consists of the following components:
- MADOC1 EEG acquisition module (download spanish user manual here)
- MADOC1 Dongle
- Microsoft Windows Notebook, Netbook or PC with NINDEX software installed
- NINDEX software USB hardware key.
Data transmission from the EEG acquisition module to NINDEX software is done via Bluetooth. MADOC1 Dongle plugs into an USB port of the Notebook, receiving the data transmitted by MADOC1 and bringing it into NINDEX software.
Features:
- Extremely low operating cost: Standard ECG electrodes can be used. Read more
- Electrode impedance measurement
- Electrical Safety: MADOC1 conforms to IEC60601-2-26
- Bluetooth data transmission from the EEG acquisition module, doing away with the annoying cable from the operating table to the anesthesic machine
- Simple operation
- Simple and friendly trend display. Read more
- Data saving to non-volatile storage. Read more
- Custom event marking. Read more
- Simple software installation
- Low cost
- Portable.
Technology review
The NINDEX number is computed in three steps, starting from the recording of one EEG channel:
- The first step is an EEG pre-processor for artifact detection. Artifact detection includes electrocautery (discarded), ocular movement (discarded), patient movement (discarded), high frequency short time artifacts (discarded), ECG interference (corrected) and pacemaker interference (corrected). In order to enhace reliability, the NINDEX monitor does not provide processed data in case of excesive corruption by artifacts
- The second step computes EEG features from the artifact-free EEG data
- The third step computes NINDEX number from the EEG features applying a multivariate statistical algorithm.
The multivariate statistical algorithm was developed on basis of a development database. The development database includes thousands of 1-minute EEG recordings from hundreds of patients receiving a wide variety of anesthetic regimens, vissually classified according to Kugler scale.
Clinical guide
The figure shows NINDEX mean value +/- standard deviation for each Kugler-scale stage, computed on 4000 1-minute EEG recordings from 70 pacients.
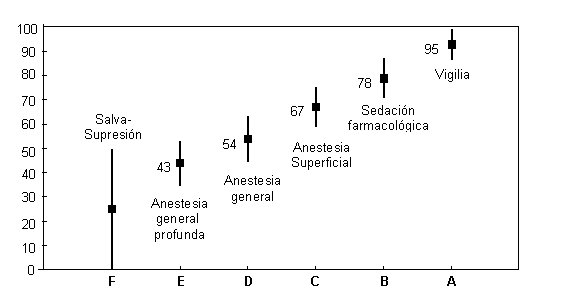
Note that:
- NINDEX values within 40 to 60 indicates classic anaesthesia stages
- NINDEX values smaller than 40 indicates deep anaesthesia levels
- NINDEX values greater than 60 indicates light anaesthesia levels
Operating the NINDEX monitor
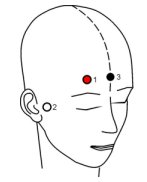
For a routine NINDEX measurement three standard ECG are attached to patient's head as shown in the figure.
To attach the electrodes on patient's head:
- With a gauze and 70% isopropanol, rub the skin in a circular motion 10-20 times or until the skin is pink
- Wet the electrode with a drop of saline, with special care to not wet the self-adhesive part
- Attach the electrode to skin, ensuring complete adherence of self-adhesive part
The EEG acquisition module connects to the electrodes as shown in the figure.
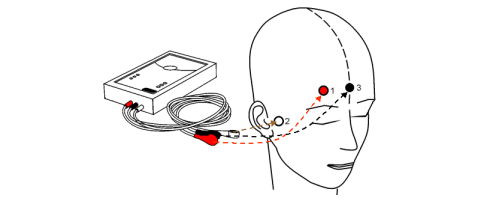
The EEG acquisition module records, amplifies and digitizes the EEG, and transmits the digitized data to the central processing unit. It also continuously checks electrodes to skin impedance, so the user gets a warning message in case of any high electrode impedance.
NINDEX-trend screen is controlled by two buttons at central processing unit:
- The "Start/Stop" button: starts and stops the NINDEX-trend screen
- The "Menu" button: shows a browseable menu to configure NINDEX-trend and to event marking.
NINDEX trend screen display
NINDEX's trend screen display is shown in the figure.
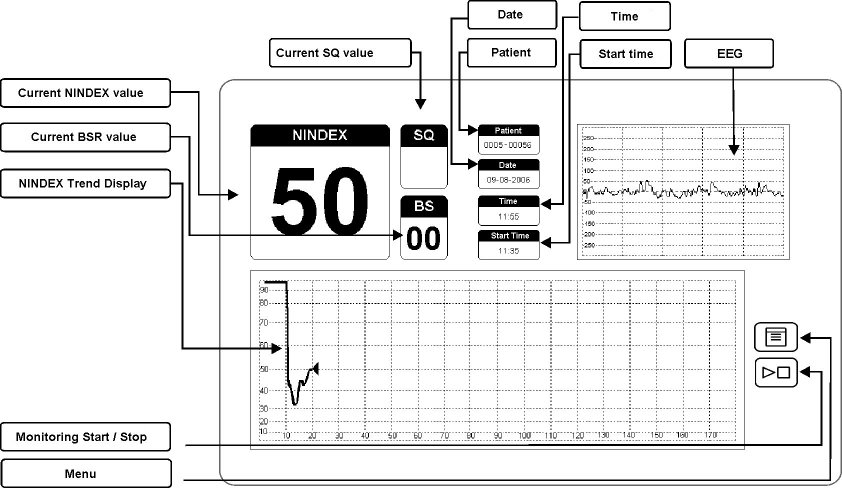
The "NINDEX" rectangle shows the instantaneous value of NINDEX number.
The "BS" rectangle show the instantaneous value of the Burst Suppression Ratio (BSR), which gives the user and indication when an isoelectric condition may exist. This parameter is the percentage of time over the last 60-second period that the signal is considered to be in the suppressed state.
The "SQ" (Signal Quality) rectangle shows the instantaneous value of the signal quality for the recorded EEG and is calculated based on artifacts. SQ value is green, yellow or red depending on percentage of discarded data over the last 60 seconds of recording.
On the top center of the screen is the recording general data. The "Paciente" rectangle shows an 8-digit number that identifies the record. The "Fecha" rectangle shows the current date. The "Hora Actual" rectangle shows the current time. The "Hora inicio" rectangle shows the starting time of the record.
On the upper right section of the screen is the EEG Waveform Display. Artifact-Discarded data is marked with diagonal lines.
On the center of the screen is the NINDEX trend display.
On the bottom of the screen is the BSR trend display.
Event marking
Event markers may be added to the display by the browseable menu. The specific event is selected from a custom event-list (i.e. "Induction", "Agent off", "MAC 1.0", etc.).
Event marks are written to non-volatile storage and are shown as labels in the NINDEX trend display.
Data storage to non-volatile storage medium
During each recording, NINDEX monitor saves this data to non-volatile storage: NINDEX trend, BSR trend, raw EEG, date, time, and event marks.
Saved data can be downloaded to a Pendrive. Windows 2000/XP PC software NINDEXMN displays recorded event marks and historical trend data in printable format.
NINDEX monitor automatically deletes saved data after 100 hours of recording.